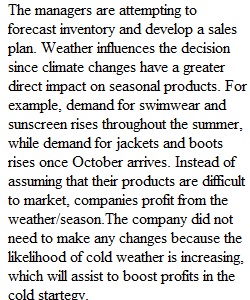


Q M.Quispe-Agnoli Spring 2022 Decision Making and Decision Analytics (BUS606.1W1) GRADED HOMEWORK ASSIGNMENT #4 Question #1 (50 points) The producers of Sublime Donuts want to install automatic dispensers in several locations in Atlanta. They want to choose the dispenser that will minimize the cost if the dispenser breaks. Monthly cost if the dispenser breaks = (number of breakdowns per month) x (time to repair the dispenser (hours)) x (cost per hour) This is the probability for Dispenser Z: Number of Repair time Average cost breakdowns Probability Probability Probability (hours) per hour per month 0 0.5 1 0.45 $10 0.7 1 0.3 2 0.55 $20 0.3 2 0.2 a) What are the factors that affect the cost of this dispenser? (6 points) b) According to the producers (at least in this question), what is the model that shows how the factors are related? (6 points) Factor Most likely Lowest possible Highest possible value value value Number of breakdowns per month 1 0 2 Repair time (hours) 1.55 1 2 Average cost per hour $13 $10 $20 c) Using the table above, perform the preliminary sensitivity analysis. Plot the tornado diagram showing the effect on cost if each factor changes from its lowest to its highest possible value. (10 points) d) Using a table of random numbers, or the command =randbetween in Excel, simulate the operation of this dispenser for 12 months. [Hint: what do you have to create first? Before the drawing of random numbers] (10 points) e) Estimate the probability distribution for the monthly cost of the dispenser. (If you extend the simulation for 500 months, would the probability distribution be the same? How does it change?) (10 points) f) Explain why the model is likely to be a simplification of the real problem. (8 points) Question 2. (50 points) In an annual meeting, managers are making plans to decide on how much to produce for the next year. This is a clothing company; seasons affect their sales. Looking at the weather forecast from the Weather Channel, they need to see if the seasons are going to be their typical temperature (average or normal), or if they will be colder, or hotter. Weather Channel’s predictions show the following probabilities for the seasons Seasons Probability Normal 0.5 Hotter 0.3 Colder 0.2 M.Quispe-Agnoli Spring 2022 The table shows the profits that this company will earn given their sales strategies(plans) and weather conditions: Seasonal Conditions Sales Strategy Normal Hotter Colder For high sales 100 400 -100 For average sales 180 200 70 For low sales 100 110 90 Given this information, a) Briefly explain the decision that the managers are trying to make and the factor(s) that affect this decision (just from the statement of this question). (5 points) b) Plot your decision tree and include the information about their probabilities and their profits. (5 points) c) What is the strategy that you would recommend (as decision analyst) to these managers? Why? (10 points) d) What is the expected value of perfect information? If Weather Channel sells their forecast, how much would this company be willing to pay? Explain (10 points) AccuWeather comes with their own forecast and says that the seasons are going to be colder, due to global warming. In a TV interview, AccuWeather representative says, “The polar vortex that paralyzed Texas will no longer be the exception but the norm”. After watching this interview, you try to find out the reliability of this source of information (and forecast). Based on past performances, these are the probabilities for AccuWeather’s forecast: Prob(colder season forecast, when the seasons will be normal) = 0.4 Prob(colder season forecast, when the seasons will be colder) = 0.6 Prob(colder season forecast, when the seasons will be hotter) = 0.3 e) Taking into account this new information, how would your tree look? Show your calculations. (10 points) f) Determine, whether the company should, in the light of the forecast, change from the decision you advised in the previous section. Explain. (10 points)
View Related Questions